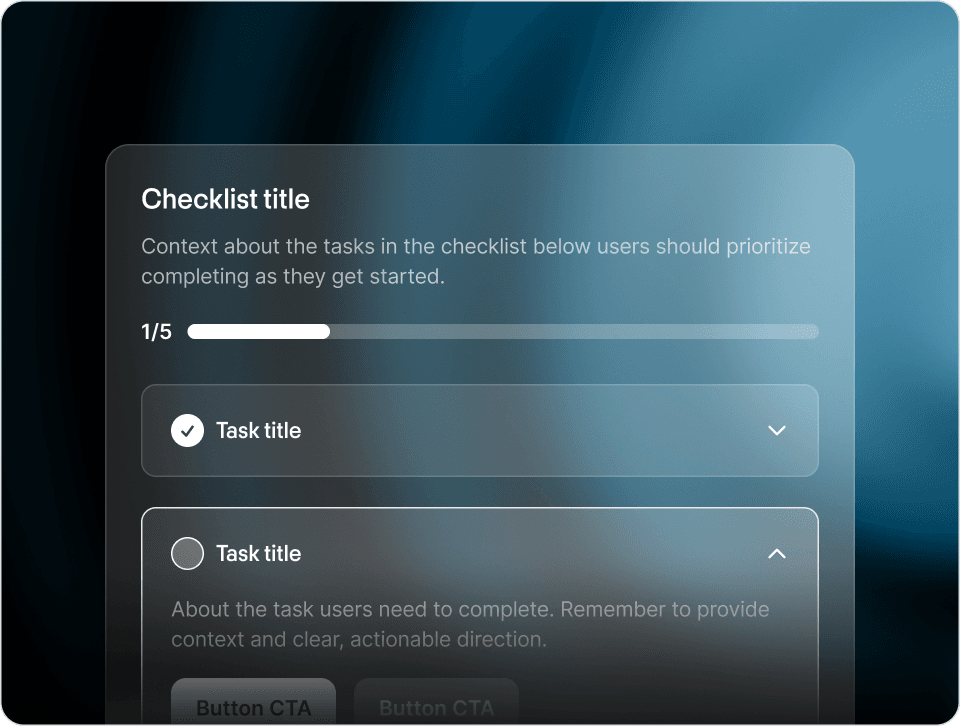
Every SaaS company eventually builds an onboarding dashboard. It usually looks something like this: signups today, signups this week, conversion rate, NPS, time on page, scroll depth.
None of those predict retention.
That is the problem. A team is told to "improve onboarding," they wire up a dashboard, every number on it goes up over a quarter, and yet the cohorts retain at the same rate. The dashboard was full of vanity metrics dressed up as activation metrics.
There is a second pattern showing up in 2026: the shape of onboarding is changing too. The teams that move retention the most are not the ones authoring better static checklists. They are the ones letting users ask the questions they actually have and answering those questions in-product, tailored to who that specific user is and what they came to do. AI-powered onboarding (think the Frigade Assistant) outperforms one-size-fits-all flows on the metrics below, because every user comes to your product with a different goal and a static flow can only ever serve the average.
Static onboarding still has a place. We will get to where it is the right call. But the metrics below were chosen specifically because they reward each individual user's experience, not the average across an authored flow.
After watching a few hundred SaaS teams go through this, here is the short list of metrics that actually predict whether a cohort sticks.
The wall clock time from signup to the moment the user does the thing your product is for. Not "logs in." Not "opens the dashboard." The thing.
For Slack, that is sending a message in a channel with at least one teammate. For Figma, that is opening a file. For Stripe, that is processing a real charge. For your product, it is whatever defines "the user got what they came for."
The shape that matters is the distribution, not the average. The average is dragged around by outliers. Look at the median, p25, and p90. A cohort where p90 is 4 minutes is a fundamentally different cohort than one where p90 is 4 days.
with first_event as (
  select user_id, min(created_at) as signup_at
  from users group by 1
),
first_value as (
  select user_id, min(created_at) as activated_at
  from events
  where event_name = 'project_created'  -- your activation event
  group by 1
)
select
  date_trunc('week', f.signup_at) as cohort,
  percentile_cont(0.5) within group (order by extract(epoch from v.activated_at - f.signup_at)) / 60 as p50_minutes,
  percentile_cont(0.9) within group (order by extract(epoch from v.activated_at - f.signup_at)) / 60 as p90_minutes
from first_event f
left join first_value v on f.user_id = v.user_id
group by 1
order by 1;
The thing AI-tailored onboarding does to this metric is collapse the long tail. A user who needs help on a specific step can ask for it and get an answer without leaving the product, which keeps p90 from blowing out into days when one user gets stuck on something the static flow never anticipated.
If your activation flow has 5 steps, you need 5 numbers, not one. The aggregate "60% of users complete onboarding" is useless because it hides where the bleed is.
Plot the funnel. The biggest drop tells you where to spend the next sprint. Usually one step is responsible for half the loss, and that step almost always does one of the following: asks for data the user does not have yet, requires a permission they did not anticipate, or requires admin access from someone else on the team.
Loom's onboarding checklist is a clean example of a static checklist done well, but it is also a textbook case of where static breaks down. Every user gets the same five steps in the same order. If the worst step asks for a teammate to invite, every solo user hits a wall there even though the step is irrelevant to them. The fix in static-flow land is almost always structural (re-order, make optional, skip for some segment) rather than copy-level.
Slice your day-1, day-7, and day-30 retention curves by whether the user activated on day 0. You will see two distinct populations.
The activated users will look healthy. The non-activated users will look like a dying battery. The gap between those two curves is the value of activation, expressed in retention points. That is the number you are trying to grow.
If you only look at one retention curve aggregated across both populations, you will think your product is fine when actually one half of it is on fire.
These are the ones that go up reliably whenever a team "ships onboarding improvements" without retention actually moving:
- Tour completion rate. Lots of users will click "next" until a tour ends. None of that means they will come back tomorrow.
- Average session duration during onboarding. Longer is not better. A user who fumbles around for 12 minutes before figuring it out is not more activated than one who succeeds in 3.
- NPS of new users. New users have not used your product yet. Their NPS is mostly a reflection of how nice your marketing site was.
- Onboarding completion rate. Same problem as tour completion. Users will mash through a checklist if it is small enough. Whether they came back is the question.
Before going further, the honest acknowledgement: static onboarding is not always wrong. It is the right tool when:
- There are 3-5 well-defined steps every user must take in roughly the same order to get value (true setup checklists, configuration wizards).
- The steps do not depend on user intent. Everyone has to verify their email; everyone has to add a payment method.
- The flow rarely changes. Auth setup, billing setup, "connect your domain."
- You need an authored marketing surface (a billing banner, a one-time launch announcement). That is just an authored experience, not really onboarding.
For most other onboarding (the "help users figure out how to use the product to do the thing they came for" surface), static is the wrong shape because users come with different goals and a static flow only serves one of them at a time.
The bare minimum is two events: signed_up and your activation event (whatever that is). Everything else can be derived.
Most teams over-instrument because they want flexibility, then end up with 200 events and no clear semantic ownership. Pick one activation event per persona (if you have multiple personas), name it carefully, and wire it everywhere it can fire.
For step completion rate, track the outcome event, not the click. "User clicked Submit" can fire even when the submit failed validation. "Project created" only fires when a project actually exists. The latter is what you want.
Once you have these three things, the workflow is dumb but effective:
- Look at the per-step funnel, find the worst step.
- Form a hypothesis about why it is the worst step.
- Ship a fix to that one step.
- Wait two weeks for the cohort to mature, then measure again.
You will be tempted to ship five fixes at once. Do not. You will not learn anything.
The teams that win at activation are the ones that pick the right single number to chase, then ruthlessly chase it. Most of the metrics on the typical onboarding dashboard are not that number.
The slowest part of the workflow above is "wait two weeks." If your product is shipping changes faster than your activation cohort can mature, you are always one cohort behind. This is the case for most early-stage SaaS, and it is the case where instrumenting the funnel by hand stops being enough.
A different shape, worth knowing about: an autonomous AI agent watching real-time user friction. The Frigade Assistant does this. It analyses behaviour as users move through the product, identifies the steps where users are getting stuck, intervenes inline (proactively, via Frigade Suggestions, before the user even thinks to ask for help), answers tailored questions when they do ask, and surfaces those friction points back to the team.
Less "wait two weeks for the cohort to mature" and more "here are the four steps that lost the most users this morning, in order." Less "every user follows the same five-step path" and more "every user gets the path that matches their goal." The cohort math gets faster, the metric distribution gets tighter, and the cases where a static flow was the wrong shape entirely get caught and fixed in real time instead of two cohorts later.
The metrics in this post still matter. The point of an AI agent is that the time between "metric moves" and "user got help" collapses from weeks to seconds, and the path each user takes is shaped by what they actually need rather than what your team authored last quarter.